Q3 2024 Earnings Conference Call and Webcast Slides
PTC India
1. Event Update | Power
August 23, 2010
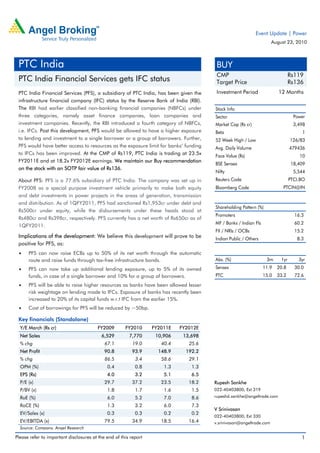
PTC India BUY
CMP Rs119
PTC India Financial Services gets IFC status Target Price Rs136
PTC India Financial Services (PFS), a subsidiary of PTC India, has been given the Investment Period 12 Months
infrastructure financial company (IFC) status by the Reserve Bank of India (RBI).
The RBI had earlier classified non-banking financial companies (NBFCs) under Stock Info
three categories, namely asset finance companies, loan companies and Sector Power
investment companies. Recently, the RBI introduced a fourth category of NBFCs, Market Cap (Rs cr) 3,498
i.e. IFCs. Post this development, PFS would be allowed to have a higher exposure Beta 1
to lending and investment to a single borrower or a group of borrowers. Further, 52 Week High / Low 126/83
PFS would have better access to resources as the exposure limit for banks’ funding Avg. Daily Volume 479436
to IFCs has been improved. At the CMP of Rs119, PTC India is trading at 23.5x Face Value (Rs) 10
FY2011E and at 18.2x FY2012E earnings. We maintain our Buy recommendation
BSE Sensex 18,409
on the stock with an SOTP fair value of Rs136.
Nifty 5,544
About PFS: PFS is a 77.6% subsidiary of PTC India. The company was set up in Reuters Code PTCI.BO
FY2008 as a special purpose investment vehicle primarily to make both equity Bloomberg Code PTCIN@IN
and debt investments in power projects in the areas of generation, transmission
and distribution. As of 1QFY2011, PFS had sanctioned Rs1,953cr under debt and
Shareholding Pattern (%)
Rs500cr under equity, while the disbursements under these heads stood at
Promoters 16.3
Rs480cr and Rs398cr, respectively. PFS currently has a net worth of Rs650cr as of
MF / Banks / Indian Fls 60.2
1QFY2011.
FII / NRIs / OCBs 15.2
Implications of the development: We believe this development will prove to be Indian Public / Others 8.3
positive for PFS, as:
• PFS can now raise ECBs up to 50% of its net worth through the automatic
route and raise funds through tax-free infrastructure bonds. Abs. (%) 3m 1yr 3yr
• PFS can now take up additional lending exposure, up to 5% of its owned Sensex 11.9 20.8 30.0
funds, in case of a single borrower and 10% for a group of borrowers. PTC 15.0 33.2 72.6
• PFS will be able to raise higher resources as banks have been allowed lesser
risk weightage on lending made to IFCs. Exposure of banks has recently been
increased to 20% of its capital funds w.r.t IFC from the earlier 15%.
• Cost of borrowings for PFS will be reduced by ~50bp.
Key financials (Standalone)
Y/E March (Rs cr) FY2009 FY2010 FY2011E FY2012E
Net Sales 6,529 7,770 10,906 13,698
% chg 67.1 19.0 40.4 25.6
Net Profit 90.8 93.9 148.9 192.2
% chg 86.5 3.4 58.6 29.1
OPM (%) 0.4 0.8 1.3 1.3
EPS (Rs) 4.0 3.2 5.1 6.5
P/E (x) 29.7 37.2 23.5 18.2 Rupesh Sankhe
P/BV (x) 1.8 1.7 1.6 1.5 022-40403800; Ext 319
RoE (%) 6.0 5.2 7.0 8.6 rupeshd.sankhe@angeltrade.com
RoCE (%) 1.3 3.2 6.0 7.3
V Srinivasan
EV/Sales (x) 0.3 0.3 0.2 0.2
022-40403800; Ext 330
EV/EBITDA (x) 79.5 34.9 18.5 16.4 v.srinivasan@angeltrade.com
Source: Company, Angel Research
Please refer to important disclosures at the end of this report 1
2. PTC India | Event Update
PFS’s shareholding pattern
PTC India holds a 77.6% stake in PFS, whereas the remaining 22.4% is shared
equally by Goldman Sachs Strategic Investments Limited (GSSI) and Macquarie
Group Limited (Macquarie).
Exhibit 1: PFS’s shareholding pattern (%)
11.2
11.2
77.6
PTC GSSI Macquarie
Source: Company, Angel Research
Exhibit 2: Project portfolio (Equity stake)
Project Location Details Stake (%)
Renewable energy
10MW biomass Maharashtra Project commissioned in FY2009 26
plant
100MW wind cum Maharashtra 41.25MW first phase to be commissioned in August 2010; 58.75MW second 37
bio-diesel project phase to be commissioned in December 2010
SPV to undertake - This SPV will scout for investment opportunities across the country. Around 50 Up to 26
500MW biomass projects have already been identified, out of which permissions for 25
and renewable projects have been received from the state government. One project is in the
energy projects process of acquisition.
3MW solar Haryana The entire land for the project has been identified and the MoU has been 37
power project signed with HAREDA. Order for equipment has been placed, which is likely to
be commissioned by December 2010.
Conventional energy
189MW imported Tamil Nadu The project is a merchant power plant and has three units of 63MW each. 26
coal project The first two units have been commissioned. The last unit is in the
synchronization stage.
270MW imported Andhra Pradesh This is a tolling project in which PTC India will be supplying coal to the 26
coal project project and will purchase power by paying conversion charges. Financial
closure for the projects has been achieved. The project is expected to be
commissioned by CY2011.
Stage 1 of Andhra Pradesh 70% of coal required for the project has got the linkage from Ministry of NA
2x660MW Coal, GOI. The required land for the project has already been acquired. The
thermal project project is expected to be commissioned by 2012.
2x350MW Orissa It is a domestic pit-head coal project, for which coal linkage has already NA
thermal project been obtained. Financial closure for the first unit has been achieved and that
for the second unit is in advanced stages. The first unit and second units are
expected to be commissioned by December 2011 and March 2012,
respectively.
Source: Company, Angel Research
August 23, 2010 2
3. PTC India | Event Update
PFS financial performance in FY2010
PFS recorded net sales of Rs49cr in FY2010, up 372% on a yoy basis. The
company’s EBITDA and PBDT rose by 487% and 323% to Rs43.6cr and Rs36.7cr,
respectively. Growth was largely driven by higher level of loan disbursement (both
term loan and mezzanine/short-term loan) to power projects and increased
fee-based income. During FY2010, the company sanctioned funds aggregating to
~Rs1,510cr to 22 power projects. During the year, the company also started
upfront financing for carbon credits.
Exhibit 3: PFS’s financial performance
(Rs cr) FY2010 FY2009 Chg [%]
Gross Sales 48.8 10.3 372
Net Sales 48.8 10.3 372
Other Income 4.7 1.3 270
Total Income 53.5 11.6 361
Total Expenditure 5.2 2.9 79
EBITDA 43.6 7.4 487
Interest 11.6 0.0 -
PBDT 36.7 8.7 323
Depreciation 0.0 0.0 -
Tax 11.3 0.2 -
Reported PAT 25.5 8.5 198
Equity Capital 435 435 -
Reserves and Surplus 200 175 14.3
Source: Company, Angel Research
August 23, 2010 3
4. PTC India | Event Update
Investment arguments
Power deficit to encourage growth
The total volume of power traded in India is just 8% of the power generated, as
reported by the power ministry in 2010. We expect the volume of power traded to
rise at a healthy rate of 14% due to the continuing power deficit and increased
power generation capacity.
Favourable government policies to aid growth
The National Electricity Policy encourages about 15% of new capacities to be tied
up in the short-term market. Growing emphasis on allowing open access to
consumers to buy power from producers in any state augurs well for power trading
companies, such as PTC India.
In January 2010, the CERC had increased the cap on short-term trading margin to
7paise/unit from the earlier 4paise/unit, which is a major boost to profitability as
the 4paise/unit cap regime was inadequate to cover the operational and market
risks borne by trading companies.
PTC India to maintain its market leadership position
PTC India is currently the leader in power trading with a market share of 45–50%.
Going ahead, we expect the company to maintain its leadership position in the
power trading market on account of its early-mover advantage and increased
volume of power traded under the long-term trade route, as close to 4,500MW of
projects for which the company has signed PPAs are set to be operational in
FY2011 and FY2012.
Transforming into an integrated player in the power sector
Apart from power trading, PTC India has also entered into other businesses such
as financing fuel intermediation, power tolling agreements and consultancy. PFS
has expanded its business considerably in the past two years.
PTC India, through its subsidiaries, is also looking at acquiring coal mines abroad
to aid its fuel intermediation and power tolling business.
August 23, 2010 4
5. PTC India | Event Update
Outlook and valuation
Going ahead, we believe PTC India's emphasis on the long-term trade (LTT)
segment will help it in sustaining higher growth. During FY2010, STT constituted
50% of the total power traded by the company. PTC India proposes to increase its
power trading mix to 70:30 in favour of LTT. The company's increased focus on
LTT is expected to provide consistent cash flows compared to STT, as the number
of units generated is expected to be uniform, resulting in reduced volatility.
Following the commissioning of new power projects, we expect PTC India to
register a 32.7% CAGR in its top line over FY2010–12E. We estimate the
company’s bottom line to register a 43.1% CAGR over FY2010–12E.
At the CMP of Rs119, PTC India is trading at 23.5x FY2011E and 18.2x FY2012E
earnings. We have arrived at an SOTP fair value of Rs136 for PTC India, wherein
we have assigned P/E of 10x FY2012E earnings from the core trading business
(Rs65.2/share), while investments in PFS, Teesta Urja, Krishna Godawari and
Athena Energy Ventures have been valued at P/BV of 1x FY2012E (Rs49.4/share).
The cash and liquid investments in the company's books are valued at P/BV of 1x
FY2012E (Rs21.1/share). Accordingly, we maintain our Buy recommendation on
the stock.
Exhibit 4: SOTP-based target price
Particulars Valuation parameter Per share value (Rs)
Core Business – Power Trading 10x FY2012E earnings 65.2
Cash and Liquid Investments 1x FY2012E book value 21.1
Investments in Subsidiaries, Associates 1x FY2012E book value 49.4
Target Price 135.7
Source: Angel Research
August 23, 2010 5
6. PTC India | Event Update
Profit and loss statement (Standalone)
Y/E March (Rs cr) FY2007 FY2008 FY2009 FY2010 FY2011E FY2012E
Net Sales 3,767 3,906 6,529 7,770 10,906 13,698
Other operating income - - - - - -
Total operating income 3,767 3,906 6,529 7,770 10,906 13,698
% chg 21.2 3.7 67.1 19.0 40.4 25.6
Total Expenditure 3,736 3,887 6,503 7,707 10,770 13,524
Net Raw Materials 3,661 3,808 6,386 7,675 10,554 13,253
Other Mfg costs 4 3 - 0 5 7
Personnel 5 7 15 18 17 22
Other 67 69 101 13 193 242
EBITDA 30 19 26 64 136 174
% chg (35.6) (36.9) 36.6 143.7 114.5 27.6
(% of Net Sales) 0.8 0.5 0.4 0.8 1.3 1.3
Depreciation& Amortisation 1 1 6 6 8 8
EBIT 29 18 20 58 129 166
% chg (36.5) (38.5) 10.8 193.8 121.4 29.3
(% of Net Sales) 0.8 0.5 0.3 0.7 1.2 1.2
Interest & other Charges 3 2 4 0 5 6
Other Income 19 43 97 74 83 102
(% of PBT) 0.5 0.8 0.9 0.6 0.4 0.4
Share in profit of Associates - - - - - -
Recurring PBT 39 52 113 131 207 262
% chg (24.6) 31.7 119.8 15.8 57.4 26.6
Extraordinary Expense/(Inc.) (7) (7) - (0) - -
PBT (reported) 46 59 113 132 207 262
Tax 11 10 23 38 58 69
(% of PBT) 27.1 19.8 19.9 28.7 28.0 26.5
PAT (reported) 35 49 91 94 149 192
PAT after MI (reported) - - - - - -
ADJ. PAT 29 41 91 94 149 192
% chg (19.8) 44.9 119.5 3.0 59.1 29.1
(% of Net Sales) 0.8 1.1 1.4 1.2 1.4 1.4
Basic EPS (Rs) 2 2 4 3 5 7
Fully Diluted EPS (Rs) 2 2 4 3 5 7
% chg (11.4) (8.5) 86.5 (20.1) 58.6 29.1
August 23, 2010 6
10. PTC India | Event Update
Research Team Tel: 022 - 4040 3800 E-mail: research@angeltrade.com Website: www.angeltrade.com
DISCLAIMER
This document is solely for the personal information of the recipient, and must not be singularly used as the basis of any investment
decision. Nothing in this document should be construed as investment or financial advice. Each recipient of this document should make
such investigations as they deem necessary to arrive at an independent evaluation of an investment in the securities of the companies
referred to in this document (including the merits and risks involved), and should consult their own advisors to determine the merits and
risks of such an investment.
Angel Broking Limited, its affiliates, directors, its proprietary trading and investment businesses may, from time to time, make
investment decisions that are inconsistent with or contradictory to the recommendations expressed herein. The views contained in this
document are those of the analyst, and the company may or may not subscribe to all the views expressed within.
Reports based on technical and derivative analysis center on studying charts of a stock's price movement, outstanding positions and
trading volume, as opposed to focusing on a company's fundamentals and, as such, may not match with a report on a company's
fundamentals.
The information in this document has been printed on the basis of publicly available information, internal data and other reliable
sources believed to be true, but we do not represent that it is accurate or complete and it should not be relied on as such, as this
document is for general guidance only. Angel Broking Limited or any of its affiliates/ group companies shall not be in any way
responsible for any loss or damage that may arise to any person from any inadvertent error in the information contained in this report.
Angel Broking Limited has not independently verified all the information contained within this document. Accordingly, we cannot testify,
nor make any representation or warranty, express or implied, to the accuracy, contents or data contained within this document. While
Angel Broking Limited endeavours to update on a reasonable basis the information discussed in this material, there may be regulatory,
compliance, or other reasons that prevent us from doing so.
This document is being supplied to you solely for your information, and its contents, information or data may not be reproduced,
redistributed or passed on, directly or indirectly.
Angel Broking Limited and its affiliates may seek to provide or have engaged in providing corporate finance, investment banking or
other advisory services in a merger or specific transaction to the companies referred to in this report, as on the date of this report or in
the past.
Neither Angel Broking Limited, nor its directors, employees or affiliates shall be liable for any loss or damage that may arise from or in
connection with the use of this information.
Note: Please refer to the important `Stock Holding Disclosure' report on the Angel website (Research Section). Also, please
refer to the latest update on respective stocks for the disclosure status in respect of those stocks. Angel Broking Limited and
its affiliates may have investment positions in the stocks recommended in this report.
Disclosure of Interest Statement PTC India
1. Analyst ownership of the stock No
2. Angel and its Group companies ownership of the stock No
3. Angel and its Group companies' Directors ownership of the stock No
4. Broking relationship with company covered No
Note: We have not considered any Exposure below Rs 1 lakh for Angel, its Group companies and Directors.
Ratings (Returns) : Buy (> 15%) Accumulate (5% to 15%) Neutral (-5 to 5%)
Reduce (-5% to 15%) Sell (< -15%)
August 23, 2010 10
11. PTC India | Event Update
Address: Acme Plaza, ‘A’ Wing, 3rd Floor, M.V. Road, Opp. Sangam Cinema, Andheri (E), Mumbai - 400 059.
Tel: (022) 3952 4568 / 4040 3800
Research Team
Fundamental:
Sarabjit Kour Nangra VP-Research, Pharmaceutical sarabjit@angeltrade.com
Vaibhav Agrawal VP-Research, Banking vaibhav.agrawal@angeltrade.com
Vaishali Jajoo Automobile vaishali.jajoo@angeltrade.com
Shailesh Kanani Infrastructure, Real Estate shailesh.kanani@angeltrade.com
Anand Shah FMCG, Media anand.shah@angeltrade.com
Deepak Pareek Oil & Gas deepak.pareek@angeltrade.com
Sushant Dalmia Pharmaceutical sushant.dalmia@angeltrade.com
Rupesh Sankhe Cement, Power rupeshd.sankhe@angeltrade.com
Param Desai Real Estate, Logistics, Shipping paramv.desai@angeltrade.com
Sageraj Bariya Fertiliser, Mid-cap sageraj.bariya@angeltrade.com
Viraj Nadkarni Retail, Hotels, Mid-cap virajm.nadkarni@angeltrade.com
Paresh Jain Metals & Mining pareshn.jain@angeltrade.com
Amit Rane Banking amitn.rane@angeltrade.com
John Perinchery Capital Goods john.perinchery@angeltrade.com
Jai Sharda Mid-cap jai.sharda@angeltrade.com
Sharan Lillaney Mid-cap sharanb.lillaney@angeltrade.com
Amit Vora Research Associate (Oil & Gas) amit.vora@angeltrade.com
V Srinivasan Research Associate (Cement, Power) v.srinivasan@angeltrade.com
Aniruddha Mate Research Associate (Infra, Real Estate) aniruddha.mate@angeltrade.com
Mihir Salot Research Associate (Logistics, Shipping) mihirr.salot@angeltrade.com
Chitrangda Kapur Research Associate (FMCG, Media) chitrangdar.kapur@angeltrade.com
Vibha Salvi Research Associate (IT, Telecom) vibhas.salvi@angeltrade.com
Pooja Jain Research Associate (Metals & Mining) pooja.j@angeltrade.com
Yaresh Kothari Research Associate (Automobile) yareshb.kothari@angeltrade.com
Shrinivas Bhutda Research Associate (Banking) shrinivas.bhutda@angeltrade.com
Sreekanth P.V.S Research Associate (FMCG, Media) sreekanth.s@angeltrade.com
Hemang Thaker Research Associate (Capital Goods) hemang.thaker@angeltrade.com
Technicals:
Shardul Kulkarni Sr. Technical Analyst shardul.kulkarni@angeltrade.com
Mileen Vasudeo Technical Analyst vasudeo.kamalakant@angeltrade.com
Derivatives:
Siddarth Bhamre Head - Derivatives siddarth.bhamre@angeltrade.com
Jaya Agarwal Derivative Analyst jaya.agarwal@angeltrade.com
Institutional Sales Team:
Mayuresh Joshi VP - Institutional Sales mayuresh.joshi@angeltrade.com
Abhimanyu Sofat AVP - Institutional Sales abhimanyu.sofat@angeltrade.com
Nitesh Jalan Sr. Manager niteshk.jalan@angeltrade.com
Pranav Modi Sr. Manager pranavs.modi@angeltrade.com
Sandeep Jangir Sr. Manager sandeepp.jangir@angeltrade.com
Ganesh Iyer Sr. Manager ganeshb.Iyer@angeltrade.com
Jay Harsora Sr. Dealer jayr.harsora@angeltrade.com
Meenakshi Chavan Dealer meenakshis.chavan@angeltrade.com
Gaurang Tisani Dealer gaurangp.tisani@angeltrade.com
Production Team:
Bharathi Shetty Research Editor bharathi.shetty@angeltrade.com
Simran Kaur Research Editor simran.kaur@angeltrade.com
Bharat Patil Production bharat.patil@angeltrade.com
Dilip Patel Production dilipm.patel@angeltrade.com
August 23, 2010 11